开始之前… #
最近接到一个需求,用于观测病人数据的心电图功能。当时看到这个功能以为只是一个图形,用 echarts
就能解决了,后来感觉比较难实现(我也不确定一定不能实现,至少会感觉很麻烦我就没有考虑这个方法)。
第一时间问了几个大模型(GPT, Claude, Gemini)给出了一致的答案,都是用 canvas
实现。
那么就开始吧。
Canvas #
这个东西不熟悉也挺熟悉的,说熟悉也感觉又不太熟悉;就是知道这个东西,但是里面的用法都不太会。
可以看看 MDN 文档里的 Canvas 介绍和教程,完全够用了。
主要用到的是 HTMLCanvasElement
这个实例,通过实例的 getContext
返回 canvas
的上下文(CanvasRenderingContext2D
),然后通过这个 ctx
来。
在画图方面就主要用到以下几个上下文的属性和方法:
名称 | 介绍 |
---|---|
strokeStyle | 形状描边的颜色 |
lineWidth | 线宽 |
beginPath() | 创建一个新路径 |
moveTo() | 在给定的 (x,y) 坐标处开始一个新的子路径 |
lineTo() | 将当前子路径的最后一个点与指定的 (x, y) 坐标用直线段相连 |
stroke() | 绘制当前或指定的路径 |
getImageData() | 返回一个 ImageData 对象,用于描述 canvas 指定区域的隐含像素数据 |
putImageData() | 将数据从已有的 ImageData 对象绘制到画布上 |
drawImage() | 在画布(Canvas)上绘制图像的方式 |
心电图 #
这是个常规的心电图的样子:
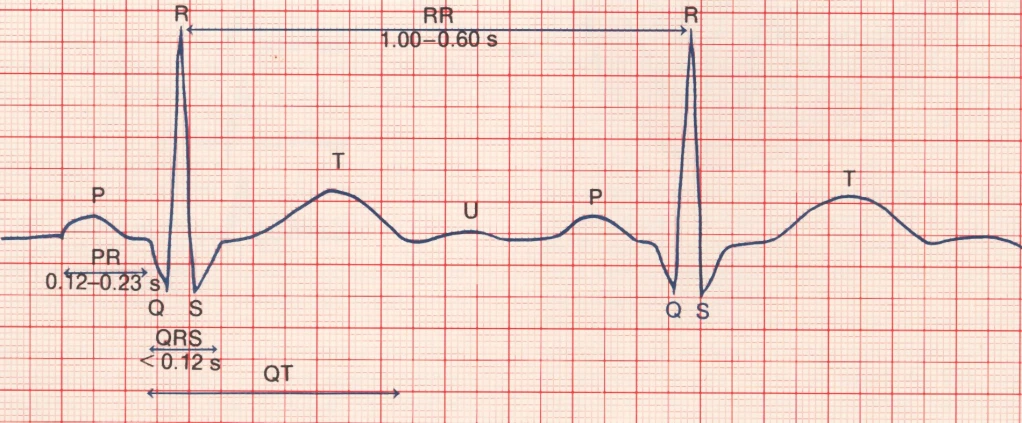
可以看到它的背景是由很多个格子组成的:每个小格代表一个单位,每五个小格组成一个大格。
每个小格代表0.04秒,每个大格代表0.2秒。
辅助线绘制 #
我这里将每个小格按照5px的宽高进行绘制。
通过遍历宽高,将累加值进行 +5 和 +25 绘制大小格:
ctx.strokeStyle = '#fecaca'
ctx.lineWidth = 0.5
ctx.beginPath()
// 竖线
for (let x = 0; x <= width; x += 5) {
ctx.moveTo(x, 0)
ctx.lineTo(x, height)
}
// 横线
for (let y = 0; y <= height; y += 5) {
ctx.moveTo(0, y)
ctx.lineTo(width, y)
}
ctx.stroke()
就得到了下面的效果:
<script setup lang="ts">
defineOptions({
name: 'ECG',
})
const props = withDefaults(defineProps<{
width?: number
height?: number
}>(), {
width: 600,
height: 150,
})
const canvasRef = ref<HTMLCanvasElement | null>(null)
onMounted(() => {
initCanvas()
})
function initCanvas() {
const canvas = canvasRef.value
if (!canvas)
return
const ctx = canvas.getContext('2d')
const width = canvas.width
const height = canvas.height
if (!ctx)
return
drawSmallGrid(ctx, width, height)
drawMainGrid(ctx, width, height)
}
function drawSmallGrid(ctx: CanvasRenderingContext2D, width: number, height: number) {
ctx.strokeStyle = '#fecaca'
ctx.lineWidth = 0.5
ctx.beginPath()
// 竖线
for (let x = 0; x <= width; x += 5) {
ctx.moveTo(x, 0)
ctx.lineTo(x, height)
}
// 横线
for (let y = 0; y <= height; y += 5) {
ctx.moveTo(0, y)
ctx.lineTo(width, y)
}
ctx.stroke()
}
function drawMainGrid(ctx: CanvasRenderingContext2D, width: number, height: number) {
ctx.strokeStyle = '#f87171'
ctx.lineWidth = 0.5
ctx.beginPath()
// 竖线
for (let x = 0; x <= width; x += 25) {
ctx.moveTo(x, 0)
ctx.lineTo(x, height)
}
// 横线
for (let y = 0; y <= height; y += 25) {
ctx.moveTo(0, y)
ctx.lineTo(width, y)
}
ctx.stroke()
}
</script>
<template>
<canvas ref="canvasRef" :width="props.width" :height="props.height" style="background-color: #fff;" />
</template>
心电图绘制 #
<script setup>
import { onBeforeUnmount, onMounted, ref } from 'vue'
const dataSource = [0, 0, 0, 0, 0, 0, 0, 0, 0, 0, 0, 0, 0, 0.01, 0.017, 0.025, 0.032, 0.039, 0.047, 0.059, 0.066, 0.072, 0.079, 0.085, 0.092, 0.1, 0.115, 0.12, 0.115, 0.1, 0.09, 0.072, 0.054, 0.032, 0.014, 0, 0, 0, 0, 0, 0, 0, 0, 0, 0, 0, -0.015, -0.04, -0.075, -0.1, 0, 0.11, 0.25, 0.36, 0.47, 0.58, 0.69, 0.78, 0.64, 0.48, 0.4, 0.32, 0.26, 0.18, 0.09, 0, -0.05, -0.1, -0.15, -0.2, -0.16, -0.12, -0.08, -0.04, 0, 0, 0, 0, 0, 0, 0, 0, 0, 0, 0, 0, 0, 0, 0, 0, 0, 0, 0, 0, 0, 0, 0, 0, 0, 0, 0, 0, 0, 0, 0, 0, 0.01, 0.015, 0.02, 0.024, 0.029, 0.033, 0.036, 0.039, 0.042, 0.046, 0.05, 0.055, 0.06, 0.065, 0.07, 0.075, 0.08, 0.085, 0.09, 0.095, 0.1, 0.105, 0.11, 0.115, 0.12, 0.125, 0.13, 0.135, 0.14, 0.145, 0.15, 0.153, 0.158, 0.163, 0.167, 0.161, 0.151, 0.142, 0.133, 0.122, 0.11, 0.09, 0.08, 0.07, 0.06, 0.05, 0.04, 0.03, 0.02, 0.01, 0, 0, 0, 0, 0, 0, 0, 0.012, 0.014, 0.018, 0.023, 0.024, 0.025, 0.024, 0.021, 0.016, 0.013, 0.009, 0.006, 0.003, 0, 0, 0, 0, 0, 0, 0, 0, 0, 0, 0, 0, 0, 0, 0, 0, 0]
const canvasRef = ref(null) // Main canvas
const bufferCanvasRef = ref(null) // Buffer canvas
const gridCanvasRef = ref(null) // Grid canvas
const roundCanvasRef = ref(null) // Round point canvas
const beatArray = ref([]) // Buffered data
const indexRef = ref(0)
const xPos = ref(0)
const endPoint = ref(0) // Last drawn point y-coordinate
const animate = ref(null) // Animation instance
const timer = ref(null) // Timer for generating data
function handleResize() {
const canvas = canvasRef.value
const gridCanvas = gridCanvasRef.value
if (!canvas && !gridCanvas)
return
const gridCtx = gridCanvas.getContext('2d', { willReadFrequently: true })
initialGrid(gridCtx, canvas.width, canvas.height)
initBufferCanvas(canvas.width, canvas.height)
}
function generateData() {
beatArray.value.push(...dataSource.slice(indexRef.value, indexRef.value + 4))
indexRef.value += 4
if (indexRef.value >= dataSource.length)
indexRef.value = 0
}
function initialGrid(ctx, width, height) {
drawSmallGrid(ctx, width, height)
drawMainGrid(ctx, width, height)
}
function initBufferCanvas(width, height) {
const bufferCanvas = document.createElement('canvas')
bufferCanvas.width = width
bufferCanvas.height = height
bufferCanvasRef.value = bufferCanvas
endPoint.value = height / 2
const bufferCtx = bufferCanvas.getContext('2d', { willReadFrequently: true })
bufferCtx.clearRect(0, 0, width, height)
}
function drawSmallGrid(ctx, width, height) {
ctx.strokeStyle = '#fecaca'
ctx.lineWidth = 0.5
ctx.beginPath()
// 竖线
for (let x = 0; x <= width; x += 5) {
ctx.moveTo(x, 0)
ctx.lineTo(x, height)
}
// 横线
for (let y = 0; y <= height; y += 5) {
ctx.moveTo(0, y)
ctx.lineTo(width, y)
}
ctx.stroke()
}
function drawMainGrid(ctx, width, height) {
ctx.strokeStyle = '#f87171'
ctx.lineWidth = 0.5
ctx.beginPath()
// 竖线
for (let x = 0; x <= width; x += 25) {
ctx.moveTo(x, 0)
ctx.lineTo(x, height)
}
// 横线
for (let y = 0; y <= height; y += 25) {
ctx.moveTo(0, y)
ctx.lineTo(width, y)
}
ctx.stroke()
}
function excute() {
const canvas = canvasRef.value
if (!canvas)
return
const ctx = canvas.getContext('2d', { willReadFrequently: true })
ctx.clearRect(0, 0, canvas.width, canvas.height)
if (animate.value)
cancelAnimationFrame(animate.value)
if (timer.value)
clearInterval(timer.value)
beatArray.value = []
indexRef.value = 0
timer.value = setInterval(generateData, 20)
animate.value = requestAnimationFrame(draw)
}
function stopAnimation() {
if (animate.value)
cancelAnimationFrame(animate.value)
if (timer.value)
clearInterval(timer.value)
}
function draw() {
const canvas = canvasRef.value
const bufferCanvas = bufferCanvasRef.value
const roundCanvas = roundCanvasRef.value
if (!canvas || !bufferCanvas || !roundCanvas)
return
const ctx = canvas.getContext('2d', { willReadFrequently: true })
const bufferCtx = bufferCanvas.getContext('2d', { willReadFrequently: true })
const roundCtx = roundCanvas.getContext('2d', { willReadFrequently: true })
const width = canvas.width
const height = canvas.height
const startPoint = height / 2
const offset = 10
if (xPos.value >= width - offset) {
const imageData = bufferCtx.getImageData(1, 0, width - 1 - offset, height)
bufferCtx.putImageData(imageData, 0, 0)
bufferCtx.clearRect(width - 1 - offset, 0, 1, height)
}
roundCtx.clearRect(0, 0, width, height)
roundCtx.beginPath()
roundCtx.fillStyle = 'red'
bufferCtx.lineWidth = 2
bufferCtx.strokeStyle = 'red'
bufferCtx.beginPath()
if (xPos.value >= width - offset)
bufferCtx.moveTo(width - 2 - offset, endPoint.value)
else bufferCtx.moveTo(xPos.value, endPoint.value)
// Calculate next point's y-position
if (beatArray.value.length > 0) {
endPoint.value = startPoint - beatArray.value[0] * 100
beatArray.value.shift()
}
if (xPos.value >= width - offset) {
roundCtx.arc(width - 1 - offset, endPoint.value, 3, 0, Math.PI * 2)
bufferCtx.lineTo(width - 1 - offset, endPoint.value)
}
else {
roundCtx.arc(xPos.value + 1, endPoint.value, 3, 0, Math.PI * 2)
bufferCtx.lineTo(xPos.value + 1, endPoint.value)
}
roundCtx.fill()
roundCtx.closePath()
bufferCtx.stroke()
ctx.clearRect(0, 0, width, height)
ctx.drawImage(bufferCanvas, 0, 0)
if (xPos.value < width - offset)
xPos.value += 1
animate.value = requestAnimationFrame(draw)
}
onMounted(() => {
if (!canvasRef.value)
return
handleResize()
window.addEventListener('resize', handleResize)
excute()
})
onBeforeUnmount(() => {
window.removeEventListener('resize', handleResize)
stopAnimation()
})
</script>
<template>
<div>
<div class="wrapper">
<canvas ref="canvasRef" width="650" height="200" />
<canvas ref="roundCanvasRef" width="650" height="200" style="position: absolute; left: 0; top: 0;" />
<canvas ref="gridCanvasRef" width="650" height="200" style="position: absolute; left: 0; top: 0;" />
</div>
<div>
<span @click="excute">excute</span> /
<span @click="stopAnimation">stop</span>
</div>
</div>
</template>
<style scoped>
.wrapper {
position: relative;
}
</style>
我们先预览下完成之后的效果。
可以看出来这个图的动态效果并不是每次走完长度后又从头(最左边)覆盖重新开始画,而是画到最右边后继续重复画在最右侧。
第一种实现效果我们只需要一个canvas
即可:
- 计算初始位置 (0, y / 2),最左侧中线位置通过
moveTo
移动到坐标点 - 根据心电图的特性,每0.2秒画一个大格,我设定每个大格25px
但是我并未完全按照特性去写,因为真正情况下心电图的数据比模拟情况下的数据频率高得多,我是用的数据是模拟1s完成的数据作为一个周期,每0.02s画四条数据,两百条模拟数据刚好1s执行完。
- 画线,提前算出下一条数据的坐标,通过
lineTo
画线(算出的坐标只是y轴,x轴是根据格子宽度去固定递增的),画完之后在下一次执行画之前,moveTo
移动到上次画线的坐标 - 判断x轴递增是否大于
canvas
宽度,超过就重置x轴位置
第二种实现方式则需要两个canvas
:
一个bufferCanvas用于绘制心电图,另一个canvas用于绘制背景。主要用到的是绘制心电图的bufferCanvas。
- 每次画都需要先判断x轴是否超出宽度,未超出同样使用上面的方法,超出后需要使用
getImageData
拿到最后一次画的那段画布,然后通过putImageData
将这段画布放到最左侧,同事清除右侧的画布 - 将bufferCanvas通过
drawImage
放到canvas上
我们主要实现第二种方式:
绘制逻辑 #
<script setup>
const canvasRef = ref(null) // Main canvas
const bufferCanvasRef = ref(null) // Buffer canvas
const beatArray = ref([]) // Buffered data
const indexRef = ref(0) // Data index
const xPos = ref(0) // 起始x轴位置
const endPoint = ref(0) // Last drawn point y-coordinate
const animate = ref(null) // Animation instance
const timer = ref(null) // Timer for generating data
function draw() {
const canvas = canvasRef.value
const bufferCanvas = bufferCanvasRef.value
if (!canvas || !bufferCanvas)
return
const ctx = canvas.getContext('2d', { willReadFrequently: true })
const bufferCtx = bufferCanvas.getContext('2d', { willReadFrequently: true })
const width = canvas.width
const height = canvas.height
const startPoint = height / 2 // 其实y轴位置
const offset = 10 // 画布最右侧空出的距离用于更好观察
if (xPos.value >= width - offset) {
const imageData = bufferCtx.getImageData(1, 0, width - 1 - offset, height)
bufferCtx.putImageData(imageData, 0, 0)
bufferCtx.clearRect(width - 1 - offset, 0, 1, height)
}
bufferCtx.lineWidth = 2
bufferCtx.strokeStyle = 'red'
bufferCtx.beginPath()
// 超过最大宽度时,只移动offset宽度画在最右侧
if (xPos.value >= width - offset)
bufferCtx.moveTo(width - 2 - offset, endPoint.value)
else bufferCtx.moveTo(xPos.value, endPoint.value)
// 计算y轴坐标,100是放大倍数,因为数据都是波动很小的小数
if (beatArray.value.length > 0) {
endPoint.value = startPoint - beatArray.value[0] * 100
// 删除已经算出的数据
beatArray.value.shift()
}
if (xPos.value >= width - offset) {
bufferCtx.lineTo(width - 1 - offset, endPoint.value)
}
else {
bufferCtx.lineTo(xPos.value + 1, endPoint.value)
}
bufferCtx.stroke()
ctx.clearRect(0, 0, width, height)
ctx.drawImage(bufferCanvas, 0, 0)
if (xPos.value < width - offset)
xPos.value += 1 // 每次画移动1px
// 重复画线
animate.value = requestAnimationFrame(draw)
}
</script>
这样我们的心电图核心逻辑就已经完成了,接下来我们需要放到html中,并且让动动起来。 数据放到文章最底部了。
<script setup>
const canvasRef = ref(null) // Main canvas
const beatArray = ref([]) // Buffered data
const indexRef = ref(0)
function handleResize() {
const canvas = canvasRef.value
if (!canvas)
return
initBufferCanvas(canvas.width, canvas.height)
}
function generateData() {
beatArray.value.push(...dataSource.slice(indexRef.value, indexRef.value + 4))
indexRef.value += 4
if (indexRef.value >= dataSource.length)
indexRef.value = 0
}
function initBufferCanvas(width, height) {
const bufferCanvas = document.createElement('canvas')
bufferCanvas.width = width
bufferCanvas.height = height
bufferCanvasRef.value = bufferCanvas
endPoint.value = height / 2
const bufferCtx = bufferCanvas.getContext('2d', { willReadFrequently: true })
bufferCtx.clearRect(0, 0, width, height)
}
function draw() {}
onMounted(() => {
if (!canvasRef.value)
return
handleResize()
window.addEventListener('resize', handleResize)
excute()
})
onBeforeUnmount(() => {
window.removeEventListener('resize', handleResize)
stopAnimation()
})
</script>
<template>
<div>
<div class="wrapper">
<canvas ref="canvasRef" width="650" height="200" />
</div>
</div>
</template>
<style scoped>
.wrapper {
position: relative;
}
</style>
如果需要添加背景格子的话,只需要在初始化的时候多用一个canvas绘制即可。
为什么直接在canvas上画格子
因为这是用两张canvas,在bufferCanvas上是白色的,每次都会把背景格子覆盖掉。
跟踪的圆点 #
我懒得写了哈哈哈哈哈,还是直接看示例里面的完整代码吧。
const dataSource = [0, 0, 0, 0, 0, 0, 0, 0, 0, 0, 0, 0, 0, 0.01, 0.017, 0.025, 0.032, 0.039, 0.047, 0.059, 0.066, 0.072, 0.079, 0.085, 0.092, 0.1, 0.115, 0.12, 0.115, 0.1, 0.09, 0.072, 0.054, 0.032, 0.014, 0, 0, 0, 0, 0, 0, 0, 0, 0, 0, 0, -0.015, -0.04, -0.075, -0.1, 0, 0.11, 0.25, 0.36, 0.47, 0.58, 0.69, 0.78, 0.64, 0.48, 0.4, 0.32, 0.26, 0.18, 0.09, 0, -0.05, -0.1, -0.15, -0.2, -0.16, -0.12, -0.08, -0.04, 0, 0, 0, 0, 0, 0, 0, 0, 0, 0, 0, 0, 0, 0, 0, 0, 0, 0, 0, 0, 0, 0, 0, 0, 0, 0, 0, 0, 0, 0, 0, 0, 0.01, 0.015, 0.02, 0.024, 0.029, 0.033, 0.036, 0.039, 0.042, 0.046, 0.05, 0.055, 0.06, 0.065, 0.07, 0.075, 0.08, 0.085, 0.09, 0.095, 0.1, 0.105, 0.11, 0.115, 0.12, 0.125, 0.13, 0.135, 0.14, 0.145, 0.15, 0.153, 0.158, 0.163, 0.167, 0.161, 0.151, 0.142, 0.133, 0.122, 0.11, 0.09, 0.08, 0.07, 0.06, 0.05, 0.04, 0.03, 0.02, 0.01, 0, 0, 0, 0, 0, 0, 0, 0.012, 0.014, 0.018, 0.023, 0.024, 0.025, 0.024, 0.021, 0.016, 0.013, 0.009, 0.006, 0.003, 0, 0, 0, 0, 0, 0, 0, 0, 0, 0, 0, 0, 0, 0, 0, 0, 0]